Lesson 1: Why Is Salt Showing Up in Our Streams?
Every winter, millions of tons of salt are spread across roads and sidewalks in the United States to keep people safe during snow and ice. This is a familiar and necessary practice, yet it raises an important question: where does all that salt go once the snow melts?
Winter weather can make driving dangerous, and spreading salt is an effective way to reduce crashes by melting ice and improving traction. Research shows that road deicing salts reduce vehicle accidents by 78 to 87 percent. In this case, a practice designed to protect people on winter roads also contributes to water pollution.
Over the past several decades, the use of road salt in the United States has increased dramatically. According to Hintz et al. (2022), the amount of sodium chloride used for deicing has tripled since the mid-1970s. Much of this salt does not remain on roadways. Instead, it dissolves, moves with melting snow and rain, and enters nearby soils, streams, lakes, and groundwater. What began as a safety solution has quietly created a growing environmental challenge.
This lesson introduces the anchoring phenomenon for the unit: rising salinity in freshwater systems. Freshwater ecosystems—including streams, lakes, wetlands, and groundwater—naturally contain very low concentrations of dissolved salt. Even small increases in salinity can disrupt aquatic life, degrade drinking water quality, and damage infrastructure. In cold-weather regions, road salt is now a primary driver of these changes.
Students begin to explore how winter road maintenance—a practice designed to protect human safety—can also create unintended environmental consequences. Using real scientific data from a recent research article, Road salts, human safety, and the rising salinity of our fresh waters by William Hintz and colleagues, students analyze patterns in road salt use and freshwater salinity across the United States. Students are not expected to master the data or reach final conclusions; instead, the goal is to spark curiosity, surface questions, and begin building explanations.
This lesson sets the tone for the unit by positioning students as investigators working with authentic scientific evidence. As they explore the data, students encounter a central tension that will carry throughout the unit: road salt improves winter safety, yet its widespread use is contributing to rising salinity in freshwater systems.
Materials:
Materials provided in the :
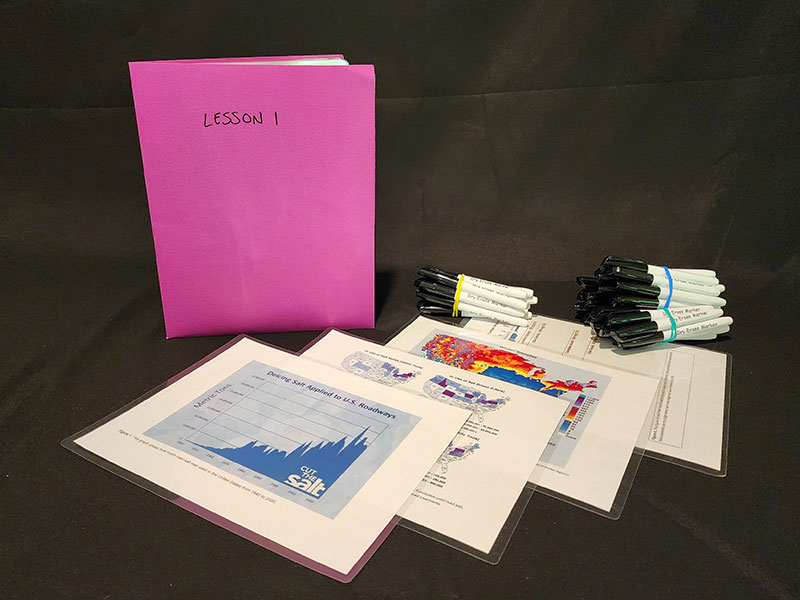
- Activity 2: Hintz et al. (2022) Data Figure Sets (8 laminated sets; 1 per student group) – Each set includes Figures 1–4, laminated and organized on a metal key ring for easy group use.
Materials you will need to gather:
- Lesson Slides
- Activity 1: Video: How Does Road Salt Work on Ice? (The Weather Channel)
- Activity 2: What the Data Tells Us Handout to print, one per student
- Assessment: Exit Ticket, Handout to print, one per student
Building a Student Journal: Keep handouts and data from every lesson. Student handouts and data sheets are intentionally designed to be revisited throughout the unit. When kept together as a journal, they support ongoing sensemaking and help students connect ideas and evidence over time.
Learning Objectives:
At the completion of this lesson, students will be able to:
- Analyze data showing patterns of road-salt use over time and across regions. STEELS Standard(s): 3.4.6-8.C, 3.4.6-8.E
- Interpret maps and graphs to explain how human safety practices impact freshwater ecosystems. STEELS Standard(s): 3.3.6-8.M, 3.4.6-8.D
- Evaluate potential human-health and environmental consequences of rising freshwater salinity. STEELS Standard(s): 3.3.6-8.M, 3.4.6-8.I
- Construct explanations for how science can help balance competing human and environmental needs. STEELS Standard(s): 3.5.6-8.H, 3.5.6-8.W
Activities:
This opening activity introduces a key idea that will carry throughout the unit: solutions to one problem can create new challenges. Students begin with something familiar—road salt in winter—and start to question what happens beyond the roadway.
To anchor the idea, display the following statement for students:
“Road salt makes winter driving much safer—car crashes drop by 78–87%—but the salt doesn’t stay on the road. It melts, washes away, and raises the salt levels in streams and drinking water.” Adapted from Hintz et al., 2022
Give students a moment to react. This is an opportunity to surface initial thinking and curiosity, not to explain the science. Before moving into data, briefly introduce the term fresh water. Invite students to share where they think fresh water is found, then clarify that it includes lakes, rivers, wetlands, and groundwater—all of which contain very low concentrations of dissolved salt. This helps establish why even small increases in salinity matter.
Show the short video How Does Road Salt Work on Ice? (The Weather Channel) to help connect students’ everyday experiences with the science of deicing.
To begin, invite students into the phenomenon through conversation. Start by asking a few open questions, meant to generate ideas and curiosity:
- Why do we use salt on roads in the winter?
- What might happen if we didn’t use road salt in the winter?
- Where do you think the salt goes once the snow melts?
Next, introduce Figure 1: Deicing Salt Applied to US Roadways (1940–2020) and give students time to quietly study the graph. Encourage students to describe before they explain and to ground their reasoning in what the graph actually shows. Prompts might include:
- What patterns do you see in road salt use over time?
- How much has salt use changed between 1990 and 2020?
- Why do you think salt use has increased so much?
Keep the focus on noticing trends, making sense of patterns, and asking questions. At this stage, students are beginning to build curiosity and identify what they need to figure out next.
In this activity, students work with authentic scientific data to begin building an explanation for the phenomenon introduced in Activity 1. The goal is not simply to read graphs, but to use evidence to support claims and to see how multiple data sources can be used together to understand a complex environmental issue.
Students explore a set of figures adapted from Hintz and colleagues (2022). Each figure provides a different piece of the story—showing how road salt use has changed over time, where it is most concentrated, and how rising salt levels are affecting lakes and streams. Taken together, these data sets help students connect human actions on land to changes in freshwater systems.
Provide each group with a laminated set of figures and the student handouts. The figures include:
- Figure 1: Deicing Salt Applied to US Roadways (1940–2020)
- Figure 2: U.S. snowfall and salt use (2016–2017)
- Figure 3: Materials applied to roads (2016–2017)
- Figure 4: Salt found in lakes and streams
Students work in small groups to match each claim on the handout to the figure that best supports it. This structure encourages students to slow down, look closely at the data, and justify their reasoning using visual evidence rather than relying on prior assumptions.
As students work, circulate and listen in on their thinking. Encourage them to point to specific features of the graphs—such as axes, color gradients, and patterns—when explaining their reasoning. Have students record evidence in the final column of the chart (“What do you see?”) and use dry-erase markers to circle trends or highlight important details directly on the laminated figures.
After groups have had time to analyze the figures, bring the class together to share and compare thinking. Ask each group to present one match they feel confident about and explain the evidence they used. For example: “We matched Claim A to Figure 1 because it shows salt use increasing over time.”
As the discussion develops, help students synthesize across the figures. Key ideas that often emerge include:
- Road salt use in the United States has increased dramatically over time
- Regions with frequent snowfall and larger populations tend to apply the most salt
- Some lakes and streams, particularly near urban areas and major roads, now show elevated salt levels
Once claims have been matched and discussed, close the activity by returning to the lesson’s central tension: How can a practice that keeps people safe on winter roads also create risks for freshwater ecosystems and human health? Encourage students to describe the cause-and-effect relationships they see in the data, connecting decisions made on land to downstream changes in water quality.
Assessment:
To close the lesson, have students complete the Exit Ticket: Where Is Road Salt a Concern? This exit ticket asks students to apply what they learned by identifying patterns in road salt use across the United States and explaining their thinking using evidence from the data. The goal is not precision, but pattern recognition. Students should begin to see that road salt use varies by region, and that environmental impacts are shaped by both natural conditions and human decisions. This also sets the stage for later lessons that shift from national patterns to local watershed impacts.