Lesson 3: Road Salt and Our Watershed: A Salty Solution or a Bitter Problem?
Winter weather can be exciting—fresh snow, icy sidewalks, and maybe even a surprise snow day. But winter weather also brings real challenges. To keep roads and sidewalks safe, salt is commonly spread to melt ice. This practice saves lives. Yet in Lesson 1, students examined national data showing that road salt use has increased dramatically and that salt concentrations in freshwater systems are rising. A clear tension emerged: a solution designed to improve safety is also changing water chemistry.
In Lesson 2, students developed a systems-level understanding of how water moves downhill through connected waterways in a watershed. They saw that materials placed on land do not remain in one location. If water flows downhill, it carries dissolved substances with it.
Lesson 3 marks a shift in the storyline from understanding how watersheds function to examining how human choices shape watershed health. This lesson focuses on the chemistry behind winter road treatments. Students investigate freezing point depression—the process by which salt lowers the temperature at which water freezes. By interfering with the formation of ice crystals, dissolved salt allows ice to melt even when air temperatures are below 32°F (0°C). Through a teacher-led demonstration and a hands-on lab, students compare how different salt concentrations affect melting and freezing behavior.
As they analyze their results, students confront an important practical question: is using more salt always better? Increasing salt concentration can improve melting under certain conditions, but it also increases the amount of salt available to move into soils, storm drains, streams, and groundwater after the snow melts. Using evidence from their investigation, students begin weighing effectiveness against environmental consequences.
This lesson deepens the unit’s central tension by connecting chemistry, watershed dynamics, and human decision-making. It prepares students for later lessons that examine salt accumulation, sustainable alternatives, and informed environmental action.
Materials:
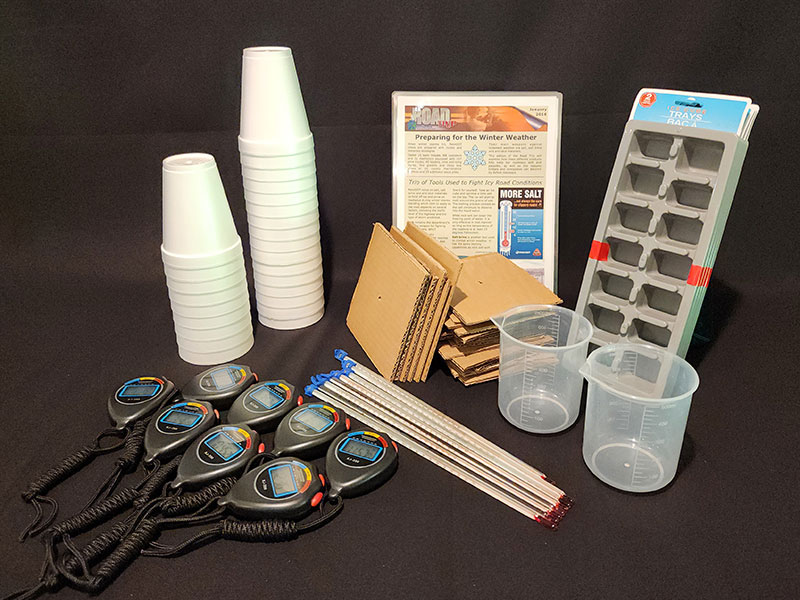
Materials provided in the :
- Activity 1: Road Trip: Preparing for the Winter Weather (8 Laminated handouts)
- Activity 1: 2 identical clear large beakers and Thermometer
- Activity 2: Laboratory Materials (8 sets - one per group)
- 3 Styrofoam cups
- 3 cardboard lids with a hole for the thermometer
- 1 thermometer
- 1 stopwatch
Materials you will need to gather:
- Lesson Slides
- Activity 1: Crushed ice or ice cubes (equal amount in each) and about an inch of water.
- Activity 1: ~½ cup of table salt
- Activity 2: Student Handout - Salty Roads, Slushy Streams Lab
- Activity 2: Laboratory Materials
- Ice cubes or crushed ice
- Cold 0% salt water (tap water)
- Cold 6% salt solution
- Cold 23% salt solution
Note: Solution preparation instructions are provided later in this lesson.
Learning Objectives:
At the completion of this lesson, students will be able to:
- Describe how salt lowers the freezing point of water. STEELS Standard(s): 3.2.6-8.F
- Measure and compare freezing points of solutions with different salt concentrations. STEELS Standard(s): 3.2.6-8.F
- Analyze multiple sources—including scientific data and public interest announcements—to weigh the benefits and consequences of using road salt in winter. STEELS Standard(s): 3.4.6-8.D, 3.4.6-8.I
- Apply scientific evidence to real-world environmental decisions. STEELS Standard(s): 3.4.6-8.D, 3.4.6-8.I
Activities:
This brief teacher-led demonstration introduces the scientific idea behind winter road treatments through a familiar and counterintuitive phenomenon: ice can melt even when temperatures remain below freezing. Students observe that adding salt changes how water behaves, setting the stage for understanding freezing point depression and why salt is used on icy roads.
The purpose of this demonstration is not to teach terminology in depth, but to anchor the chemistry that follows in a clear visual experience students can return to throughout the lesson.
Begin by drawing on students’ prior experiences. Ask whether they have seen trucks spreading rock salt or brine on roads before or during winter storms, and invite a few ideas about why that happens. Let students know they will test what salt actually does to ice—without adding heat.
Set out two identical beakers filled with ice and a small amount of water. Insert a thermometer into each and have students note the starting temperature, which should be close to 32°F (0°C). Explain that salt will be added to one beaker while the other will remain plain ice. Invite students to predict which beaker will melt faster and why. Add approximately ½ cup of table salt to only one beaker.
As the demonstration unfolds, pause periodically to stir the beakers and ask students what they notice. Is liquid water forming? Does one beaker change more quickly? What is happening to the temperature?
During the Demonstration: Share the Road Trip: Preparing for the Winter Weather handout while students observe the ice melting. The short reading provides a real-world explanation of how freezing point depression is used to improve road safety and helps students connect the classroom demonstration to everyday winter decisions.
Students will observe that although both beakers remain near freezing, the salted ice begins to melt more quickly. The key idea to emphasize is that salt lowers the freezing point of water. This process—known as freezing point depression—allows ice to melt even when temperatures are below 32°F (0°C). No added heat is required. This demonstration provides a clear, shared reference point for the lab that follows.
Lesson Preparation
For this activity, prepare three solutions ahead of time and refrigerate so they are cold and ready for the lab.
| Solution | Grams of Salt (for 2 L) | Final Volume | Expected Freezing Point |
|---|---|---|---|
| Tap Water (0%) | 0 g | 2 L | ~32°F (0°C) |
| 6% Salt Solution | 116.9 g | 2 L | ~21°F (−6°C) |
| 23% Salt Solution | 467.5 g | 2 L | ~−6°F (−21°C) |
Mixing Instructions: Add about 1.5 liters of warm tap water to a container. Slowly add the salt while stirring until dissolved. Add additional water to bring the final volume to 2 L. Label each solution clearly (0%, 6%, and 23%). Food-grade table salt is used for this activity—one standard salt container is approximately 700 grams.
Students may not reach the exact freezing points listed above under typical classroom conditions, but they should observe the pattern: higher salt concentrations allow water to remain liquid at lower temperatures.
Lab Overview
In Activity 1, students observed something surprising: ice treated with salt melted even without added heat. Now they take a closer look at what is happening. Students add solutions containing different amounts of salt to ice and measure temperature over time. A pattern starts to emerge—the more salt that is added, the lower the temperature the mixture can reach.
The solutions used are intentionally chosen to reflect real-world conditions. Students compare plain water (0%), a moderately salty solution (6%), and a highly concentrated solution (23%). A 23% salt solution is similar to the brine often applied to roads before winter storms, helping students see that the chemistry they are investigating mirrors actual winter road management practices.
What is a calorimeter? A calorimeter is a container that helps limit heat transfer so temperature changes can be measured more clearly. In this lab, it’s nothing fancy—just a Styrofoam cup with a lid and thermometer.
In this investigation, students explore the question: How does salt affect the temperature at which water freezes?
Students compare three solutions—plain water (0% salt), a 6% salt solution, and a 23% salt solution (similar to road brine)—by adding each to ice and:
- Measuring temperature over time
- Identifying the lowest stable temperature reached
- Recording and comparing results across the class
Encourage groups to share their data so students can look for consistent patterns across multiple trials.
Discussion
As students share their ideas, guide the conversation toward real-world impacts. Using more salt helps keep roads safe in colder weather, but it also means more salt can wash into soil, streams, and groundwater after the snow melts. This creates a trade-off between keeping people safe in winter and protecting the health of our waterways.
Guide discussion toward real-world decision-making:
- Who benefits from road salt use?
- Who might be impacted by salt pollution?
- How do communities balance safety and environmental impact?
This reinforces that science involves trade-offs, not just right answers. Scientific decisions are not purely technical—they involve weighing benefits, risks, and impacts across communities.
To close the activity, share that effective deicing requires far less salt than many people assume. A common guideline is about one grain of rock salt every three inches—roughly equivalent to spreading a single 8 oz glass of salt across ten 4 ft × 4 ft sidewalk squares. This comparison helps students connect their lab results to real-world practice and prepares them for later lessons on sustainable solutions.
Adaptations & Extensions:
Extension 1: How Much Salt Is Really Needed to Treat the Sidewalk?
On the lab handout in Activity 2, students learned that an 8 oz cup of salt is enough to treat approximately ten 4 ft × 4 ft sidewalk squares. But what does that actually look like? Fill an 8 oz cup with sand (sand is used instead of salt to avoid environmental impacts and cleanup concerns). Take students outside to a sidewalk and identify ten adjacent sidewalk squares, approximately 4 ft × 4 ft each. Have students work together to spread the sand as evenly as possible across all ten squares.
Extension 2: Regional Salt Concentration Comparisons
Encourage students to explore which communities receive more or less road salt. Are there patterns based on location, income, or population density? Use the EJ Screen mapping tool to help students identify trends.
Assessment:
The following questions are included in the student handout. These prompts help students connect their lab data to the anchoring phenomenon and think critically about the trade-offs of using road salt.
1. Use Claim-Evidence-Reasoning (CER) to answer this question: Is road salt an effective solution for keeping roads safe in winter?
- Claim
- Write a sentence that answers the question above.
- Evidence
- Include specific temperatures from your data table.
- Reasoning
- Explain how freezing point depression supports your claim.
-
2. Is using more salt always better?
Use your lab results to think about this. What happened when more salt was added? Does more salt help in colder weather? What are the risks of using too much salt?
-
3. Where does the salt go after the snow melts?
How could it affect streams, rivers, plants, or animals in your community?