Lesson 6: We’ve Got a SALTY Problem: Stormwater Event Data Analysis
Road salt keeps us safe in winter. Earlier in this unit, students examined national data showing that road salt use has increased dramatically over time and that freshwater salinity is rising across the United States. They identified a troubling pattern: a practice designed to improve winter safety is also changing water chemistry across the country.
In Lesson 6, students begin to put more pieces of the puzzle together, connecting what they know about salt, ice melt, runoff, infiltration, and land use to what is happening in real streams. The patterns they first noticed in national graphs now become visible at a more immediate scale. Instead of looking at decades of change, students examine what happens in a stream during and after a winter storm.
Students analyze and interpret authentic environmental data from a site in Erie, Pennsylvania and act as environmental detectives to investigate how road salt affects the local waterway. Using conductivity graphs, stream height data, weather records, and watershed maps, they look for patterns that reveal how salt moves from roads into streams. Through guided data interpretation and discussion, students connect their earlier learning about freezing point depression, runoff, and watershed systems to measurable changes in water quality.
The lesson is divided into two parts. First, you will guide students through the analysis of a real-world conductivity graph from Monitor My Watershed. Conductivity—the measure of how well water conducts electricity—can serve as an indicator of the presence of dissolved ions in the water, such as road salt. Take time to help students understand the axes, identify baseline conditions, and recognize spikes in the data. This shared analysis builds confidence and prepares students for deeper investigation.
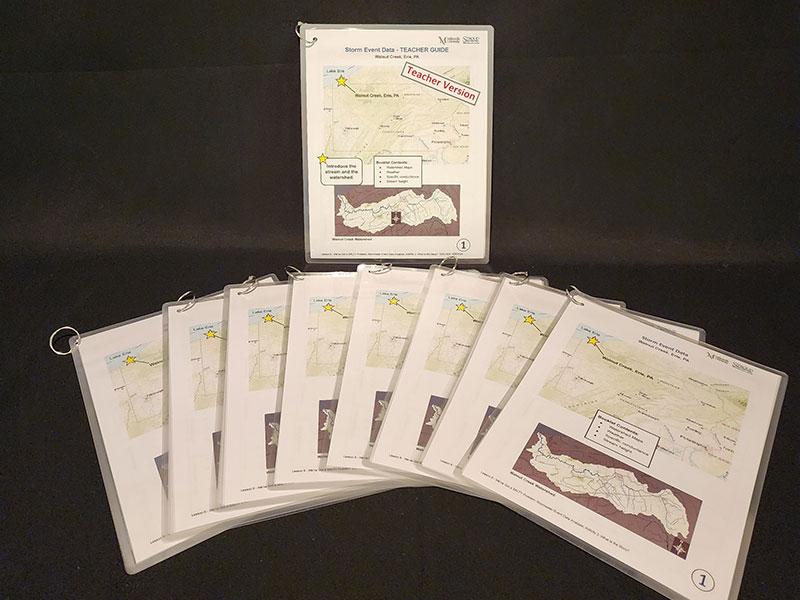
In the second portion of this lesson, students analyze a stream scenario from northwestern Pennsylvania. Students will familiarize themselves with the watershed before diving into data from a particular point in time: a winter storm. Each group receives a data packet containing graphs, maps, and contextual information. A teacher guide containing explanatory information, teaching tips, extra definitions, and discussion questions is included to help you guide students through the data sets.
While this is a complex lesson, it is also a powerful one. Students will work with authentic environmental data, hopefully making the connection that maps and graphs tell stories. Encourage students to look for patterns, ask questions, and make connections across different types of information. If time allows, invite students to further investigate the watershed through satellite images, local news articles, municipal websites, watershed association pages, and state environmental agency resources. By pairing quantitative data with real-world images and community narratives, students gain a more complete picture of how road salt moves through living systems and affects local waterways. This lesson prepares students for Lesson 7, where they will investigate stream chemistry more directly.
Vocabulary Support — Talking About Salt in Water
- Salinity: Salt content in water. Measured in this course via chloride tests or conductivity.
- Conductivity: Measures how well water conducts electricity; influenced by the presence of dissolved ions. Higher conductivity usually means more dissolved pollution is present—especially after a snowstorm.
- Specific Conductance: Conductivity adjusted for temperature. The terms are often used interchangeably.
- Chloride: A specific ion found in road salt that contributes to conductivity.
These terms are connected—chloride contributes to salinity, and salinity increases conductivity—but they are not interchangeable. In this curriculum, we will primarily use conductivity for ease.
Materials:
Materials provided in the :
- Activity 2: Storm Event Data (Teacher Guide)
- Activity 2: Student Handout: Storm Event Data (1 per/group) each packet contains:
- Watershed maps
- Weather data
- Specific conductance graph
- Stream height graph
Materials you will need to gather:
- Lesson Slides
- Activity 1: Conductivity graph from Vine Creek in Bala Cynwyd, PA (date range January 21 to February 21, 2025)
- Activity 1: Student Handout: Interpreting Water Quality Data: Conductivity
- Activity 2: Student Handout: Storm Event Investigation, 1/student
Learning Objectives:
At the completion of this lesson, students will be able to:
- Interpret and compare graphs and composite sets of data. STEELS Standard(s): 3.4.6-8.C, 3.5.6-8.O
- Make conclusions about stream health from different data sets. STEELS Standard(s): 3.4.6-8.C, 3.4.6-8.E
- Identify ways human activities and factors can affect stream chemistry, particularly relating to road salt. STEELS Standard(s): 3.3.6-8.M, 3.4.6-8.E
- Understand the relationship between road salt, conductivity, and salinity. STEELS Standard(s): 3.3.6-8.M
Activities:
In this short activity, students look at real stream data from Pennsylvania to see how salt from winter storms affects water quality. The goal is to help them connect their earlier lab work with what’s happening in actual local waterways.
Begin by showing students the conductivity graph from Vine Creek in Bala Cynwyd, PA on the Monitor My Watershed website. Set the date range to January 21 to February 21, 2025. Use the handout so students can follow along. Have students look at the graph and notice two key things: a fairly steady baseline during dry winter days and big spikes in early February. Let them know these spikes happened right after snowstorms.
Ask:
- What do you notice about the shape of the graph?
- When do the spikes happen, and what might be causing them?
- Why would this matter for fish, plants, or people using this water?
What Is Conductivity?
Conductivity measures how easily electricity can pass through water. Pure water cannot conduct electricity well, but streams do because they contain dissolved particles called ions. Ions are naturally occurring but can increase or decrease because of pollution.
Scientists measure conductivity in microsiemens per centimeter (μS/cm) to check stream health and test for pollution. If you have one available, show students a conductivity meter. How far apart are the electrodes—the metal points at the bottom? They are usually 1 cm apart. The meter passes electricity between the electrodes to measure the conductivity of the water.
Briefly explain that specific conductance increases as more dissolved substances (like road salt) enter the water. After a winter storm, snow and ice mix with road salt, melt, and run off paved surfaces into nearby streams, increasing the conductivity of the water.
This quick look at real data helps students connect what they’ve already learned to the bigger picture. That same salt that lowers the freezing point of water shows up in our streams and can be tracked through changes in water chemistry. It’s a powerful way to bring the unit’s essential question into focus: How can we balance winter safety with the health of our watershed?
In this investigation, students analyze real storm event data to determine how winter weather and road salt affect stream chemistry. Using site photos, watershed and land cover maps, weather data, and graphs showing stream height and specific conductance, students look for patterns that help explain what is happening in the stream during a storm event and how salt may be moving from roads into the water.
This activity scaffolds students’ data analysis skills. Students work in small groups while the teacher guides the class through the analysis section by section using the Storm Event Data worksheet and the Storm Event Data Teacher Guide. The Storm Event Investigation worksheet structures the analysis using the following sequence: Notice and Wonder → Read the Data → Look for Patterns → Think About the Watershed → Explain What Is Happening in the Stream → Scientific Explanation.
Part 1: Notice and Wonder
Begin by displaying the Storm Event Data for the class. Have students familiarize themselves with the maps and think about what they can tell us. Have students carefully examine the weather data, stream height graph, and conductivity graph before attempting to interpret them. At this stage, the goal is observation, not explanation. Invite students to share what they notice, encouraging them to describe patterns, shapes, spikes, or changes over time.
Then ask students what they wonder. Questions often include:
- Why do some lines spike suddenly?
- What might cause the stream height to increase?
- Why would conductivity change after a storm?
Record several student observations and questions on the board. This discussion helps students begin thinking like scientists by separating observation from explanation.
Part 2: Read the Data
Guide students through the first set of questions together. At this stage, students focus on extracting information directly from the graphs and data tables. Take your time and help students locate key features such as: dates on the x-axis, units on the y-axis, weather events in the data table, and peaks in stream height and conductivity. This is an opportunity to teach graph literacy and use the weather page to think about how we turn data in tables into graphs.
Ask students to identify when rainfall occurred, when stream height increased, and when conductivity levels changed. This step helps students build confidence reading environmental data before moving into deeper interpretation.
Teacher Tip: You don’t need to lecture or pre-teach the graphs—let the students do the digging. Encourage them to notice patterns, ask questions, and talk through their thinking. Some may struggle at first, and that’s okay! It’s part of learning to work with complex data.
Part 3: Look for Patterns
Next, students look for relationships between the different data sets. Prompt them to compare the weather data with the stream height and conductivity graphs.
Ask questions such as:
- What happened to stream height after the rain?
- What happened to conductivity levels after the rain?
- Did the patterns occur at the same time or at different times?
Students should begin noticing that rainfall increases stream height and may influence conductivity levels. Emphasize that scientists often look for patterns across multiple data sources to understand environmental events.
Part 4: Think About the Watershed
Now ask students to connect the patterns in the data to what they know about watersheds and runoff. Students should consider how rain or snowmelt moves across land surfaces and carries dissolved materials into streams. Prompt them to think about how land cover influences this movement—applying ideas from earlier lessons on runoff, infiltration, and land use.
Questions may include:
- How might rain change the height of a stream?
- How could water move salt from roads and parking lots into nearby streams?
- How might forests, grass, roads, and parking lots affect how water and salt move through the watershed?
Part 5: Explain What Is Happening in the Stream
After students have examined the patterns, ask them to construct an explanation using Claim, Evidence, and Reasoning (CER). Students develop a claim describing what they think happened in the stream during the storm event. They then use specific evidence from the graphs or weather data to support their claim.
Encourage students to cite at least two pieces of evidence from the data—for example, a spike in stream height following rainfall or a change in conductivity during the same time period. Students should then explain how their evidence supports their claim by connecting rainfall, runoff, and watershed processes.
Part 6: Scientific Explanation
Finally, students synthesize their thinking using the sentence frame provided in the worksheet. This structure helps students translate their CER thinking into a clear scientific explanation. Remind students that environmental explanations often involve multiple interacting factors, such as weather events, land cover, and human activities like road salt application.
Ask them to work through the Storm Event Investigation worksheet together. As groups work, circulate and listen to their discussions. Encourage students to support their ideas by pointing to specific evidence in the data.
Whole Class Discussion
Bring the class back together and invite groups to share their explanations and the evidence they used. Students will likely find that at Walnut Creek, a snowstorm followed by melting led to salt runoff, and spikes in specific conductance match the rise in stream height.
Use the comparison of specific conductance and stream height graphs to highlight an important idea: graphs may look similar, but the story behind them can be very different depending on weather events, land cover, and human activity within the watershed. Scientists must use both data and context to understand what is happening in natural systems. The goal of this discussion is not for students to arrive at perfect answers—the purpose is to help students practice interpreting real data and explaining their thinking using evidence.
Adaptations & Extensions:
Interpreting Data with Monitor My Watershed
Use Monitor My Watershed to explore conductivity graphs from your area during and after snow events. Take a moment to talk about the value of long-term stream monitoring. What can we learn by comparing data over time, across seasons, or at different points along the same stream? This is also a natural place to introduce the idea of pollution tracking—scientists look for patterns in data, like sudden spikes, to help identify possible pollution sources or problem areas.
Compare Multiple Sites
Use the Watershed Scenario Booklet and accompanying Teacher Guide to analyze Walnut Creek in Erie, PA and then compare it to Avondale, PA. The same data and graphs are presented across the same timeframe, but at the Avondale site it only rained—no snow, so no salt was applied. Have students try to figure out why conductivity drops at Avondale instead of spiking as it does in Erie. This is an opportunity for students to compare multiple types of data across different sites.
Assessment:
Exit Ticket (CER Response) – Road Salt and Stream Health
Question: What does your stream data show about where road salt goes after a snowstorm?
- Claim
- Based on your group’s data, what happened at your stream site? Did road salt end up in the stream?
- Evidence
- Use two pieces of evidence from your packet (like a graph, map, or photo) that show how salt or stormwater affected the stream.
- Reasoning
- Explain how your evidence shows that road salt doesn’t stay on the road. How did it move into the stream, and why does that matter for water quality?