Lesson 7: Localizing the Issue: Stream Chemistry and What It Means to Us
In the previous lesson, students analyzed storm event data and observed spikes in conductivity following winter storms and snowmelt. Those patterns suggested that road salt applied to roads can be transported into streams by stormwater runoff and melting snow.
In this lesson, students move from analyzing existing data to collecting chemical evidence from their own local stream. Using chloride test strips and, optionally, a conductivity meter, they will investigate whether road salt may be influencing stream chemistry and water quality in their watershed.
The lesson materials include chloride test strips, but if you have access to a conductivity meter, it is highly recommended that you use it alongside the chloride test strips. Conductivity and chloride provide complementary information about stream chemistry. Conductivity measures the total amount of dissolved ions in the water, while chloride serves as a practical indicator of road salt contamination. Comparing both measurements allows students to make stronger claims about whether road salt is influencing the chemistry and health of their local stream.
Freshwater naturally contains small amounts of dissolved minerals, so every stream has a baseline conductivity that changes with rainfall, groundwater, and seasonal conditions. While we cannot see dissolved road salt, we can detect its presence by measuring conductivity and chloride. These tests are straightforward and repeatable, making them well suited for ongoing seasonal monitoring if you choose to extend the investigation.
To help students connect these chemical measurements to the real world, in the next activity they will prepare and taste a series of saltwater solutions representing chloride concentrations found in freshwater streams. This investigation transforms abstract numbers into meaningful experiences while reinforcing the connection between road salt, stream chemistry, and watershed health. For additional background and community resources, check out Stroud Water Research Center’s Cut the Salt Initiative.
Materials:
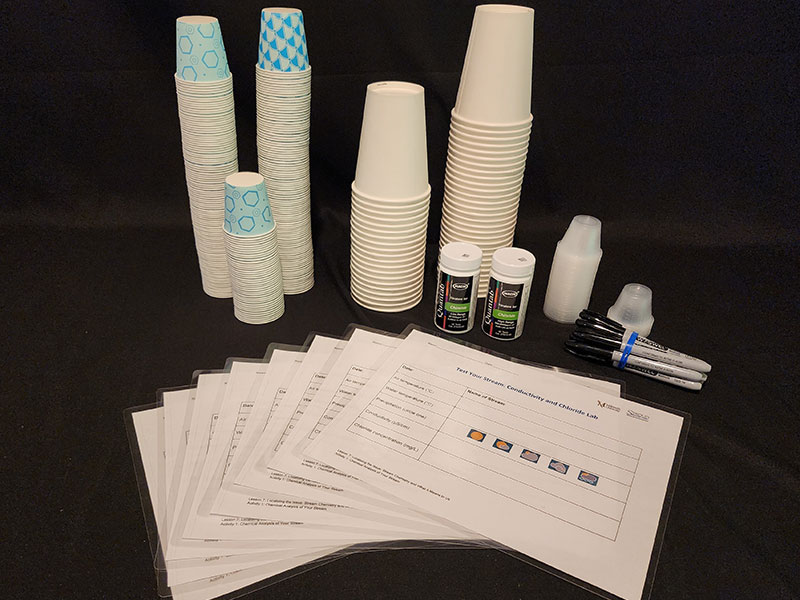
Materials provided in the :
- Activity 1: 1 medicine cup/group
- Activity 1: Chloride QuanTab® Test Strips (Low Range 30-600 mg/L and/or 300 to 6000 mg/L)
- Activity 1: Laminated Instructions for use of Chloride QuanTab Test Strips
- Activity 2: Materials per group
- Plastic spoons for weighing salt and stirring
- 5 medicine cups (for salt)
- 6 disposable 12 oz. paper cups (one marked at 250 mL)
- Small (Dixie) paper tasting cup, 1 per student in group
- 1 Permanent marker
NOTE: Students will be tasting these samples – it is essential that you use clean cups and spoons throughout.
Materials you will need to gather:
- Lesson Slides
- Activity 1: Sample of water from a stream (at least ½ gallon per class)
- Activity 1: Student Handout: Test Your Stream: Conductivity and Chloride Lab Data Sheet
- Activity 1: Optional: Conductivity meter and calibration solution
- Meter - Hanna DiST®4 Waterproof EC Tester, High Range 0-20.00 mS/cm, ~$80 (Student Instructions for Use and Teacher Calibration Instructions)
- Calibration Solution -Hanna High Range 12880 µS/cm Conductivity Standard, ~$40
- Activity 2: Student Handout: How Salty Are Our Streams?
- Activity 2: Distilled water 1 gallon, Table salt
- Activity 2: Digital scale. The scale should measure to 0.01 g. (0.001g is best; teacher provides)
- Activity 2: Optional: Show container of road salt and cup depicting proper salt application density
Learning Objectives:
At the completion of this lesson, students will be able to:
- Conduct basic chemical analysis of streamwater in relation to road salt. STEELS Standard(s): 3.4.6-8.E
- Make conclusions about stream health from data taken by students. STEELS Standard(s): 3.4.6-8.C, 3.4.6-8.E, 3.5.6-8.O
- Understand the relationship between road salt, conductivity, and salinity, and their impact on the environment. STEELS Standard(s): 3.3.6-8.M, 3.4.6-8.H
- Relate to the data they have studied and explain from their own experience how salty water is at different salt thresholds. STEELS Standard(s): 3.3.6-8.M
Activities:
Activity 1 Preparation
Collecting Stream Water: You can do this investigation at a nearby stream, river, or lake, or bring a bucket of water into the classroom. Collect the sample from a location that is at least 6 inches deep. Be sure to record the temperature of the stream to share with the class.
If you’re able to take the students to the stream, it’s worth it! Being at the water helps students connect to the place in a way that’s hard to replicate indoors. If getting outside isn’t possible, take a few photos of where the water was collected and share them with students — even that small step helps keep the learning tied to a real place.
Student Safety at the Stream: If you’re heading to a stream, visit the site ahead of time. Look for an entry point that’s stable and not too steep or muddy. Keep an eye out for litter, poison ivy, or stinging nettle. Students should not enter water deeper than their knees, especially if it’s moving. Avoid going out during bad weather or when water levels are high. It’s also helpful to have a few extra adults for supervision. Assume someone will get wet — plan for it with a warm day and/or a change of clothes.
Activity 2 Preparation: Before class, mark a 250 mL line on the appropriate number of disposable cups to use as measuring cups — each group will need one marked cup.
In the previous lesson, students examined storm event data and observed conductivity spikes following winter storms and snowmelt. Now they will collect their own data by chemically analyzing water from a local stream. (If students are unable to visit the stream, collect the water sample beforehand and record the stream temperature to share with the class.)
Working in small groups, students will test the stream water for chloride using QuanTab® chloride test strips. If you have access to a conductivity meter, students should also measure conductivity so they can compare the two results. Together, these measurements provide stronger evidence about whether road salt may be influencing the chemistry of their local stream.
Two ranges of QuanTab® test strips are included because chloride concentrations vary widely among streams. The Low Range (30–600 mg/L) strips are appropriate for most freshwater streams with relatively low chloride concentrations. The High Range (300–6000 mg/L) strips are designed for streams with elevated chloride levels, particularly in heavily developed or urban watersheds. Review the expected chloride concentrations for your stream before selecting which strips to use.
Be aware that some rural or minimally developed streams may have chloride concentrations below 30 mg/L, which is below the detection limit of the Low Range test strips. If this occurs, the conductivity measurement can still provide useful information. Before the lesson, check Monitor My Watershed to see the typical conductivity values for your stream. Comparing students’ measurements to long-term data helps reinforce that water quality is best understood by looking for patterns over time rather than interpreting a single measurement in isolation.
After testing, compile the class data and discuss the results together. Ask students: What do these measurements suggest about our stream? How do our results compare with the typical conditions for this watershed? Do they raise new questions about road salt, weather, or seasonal change? Encourage students to use both the conductivity and chloride data as evidence when making claims about the possible influence of road salt on stream chemistry.
This activity has been adapted from a public outreach and training program developed by David Bressler, Katie Bille, and Dr. John K. Jackson of Stroud Water Research Center.
Important Safety Note: Students typically do not eat or drink in a science classroom. This activity is a structured exception. Do not use lab glassware or laboratory equipment. Use only disposable cups, clean stirrers, and food-grade table salt.
Students have discovered that road salt changes the chemistry of freshwater streams, but what do those numbers actually mean? In this activity, they prepare and taste a series of saltwater solutions that represent real chloride concentrations found in freshwater—from pristine streams to urban waterways after winter storms. As students carefully taste each solution, the data takes on a different kind of meaning. What once looked like a number on a chart suddenly has flavor, helping students connect chemical measurements to real-world conditions and deepening their understanding of how road salt affects the health of their own watershed.
Use the How Salty Are Our Streams? student handout to guide groups through measuring distilled water, weighing salt, mixing the solutions, and recording their taste observations. Before students begin mixing, have them pause to compare the salt amounts in the medicine cups. This is often a powerful moment—the visible amount of salt may seem surprisingly small compared with the large changes in chloride concentration it represents.
As students taste the samples, remind them to:
- Move in order from lowest to highest salt concentration
- Rinse their personal tasting cups between samples
- Only taste the solutions they prepared themselves
Encourage them to describe each sample using everyday comparisons—such as “tap water,” “soup,” “tears,” or “ocean water”—before revealing or discussing the stream conditions each sample represents.
After students complete the tasting, bring the class together to connect the experience back to their stream data. Ask: Which sample was most similar to the chloride level measured in our stream? Where does our stream fall on the continuum of salt concentrations? Were any samples saltier or less salty than expected? How does tasting these samples change the way you think about chloride numbers on a data table?
Salt enters streams through stormwater runoff and groundwater movement. In many Pennsylvania streams, chloride levels now exceed federal chronic exposure recommendations for aquatic life and secondary drinking water standards. Use this discussion to help students connect the tasting experience to the larger question of how road salt affects freshwater ecosystems and why reducing unnecessary salt use matters.
Teacher Note: Sample 3 (100 mg) represents approximately the point at which many people begin to detect a salty taste in drinking water. The remaining samples represent chloride concentrations commonly found in pristine freshwater streams, urban streams, and seawater, helping students relate chemical measurements to real-world conditions.
Adaptations & Extensions:
Outdoor Field Experience
If you take the class to the stream for Activity 1, you can also include a physical stream assessment. A physical survey is a great tool that generates a third way to look at stream health.
Assessment:
-
Exit Ticket
Based on our conductivity and chloride data, what do our results suggest about salt levels in our stream? Use one piece of evidence.
-
Stream Comparison
Which sample from Activity 2 is our stream most similar to? How do you know?
-
Environmental Impact
If chloride levels increase in winter, how could that affect aquatic life in our stream?