Lesson 1: All the Water on Earth
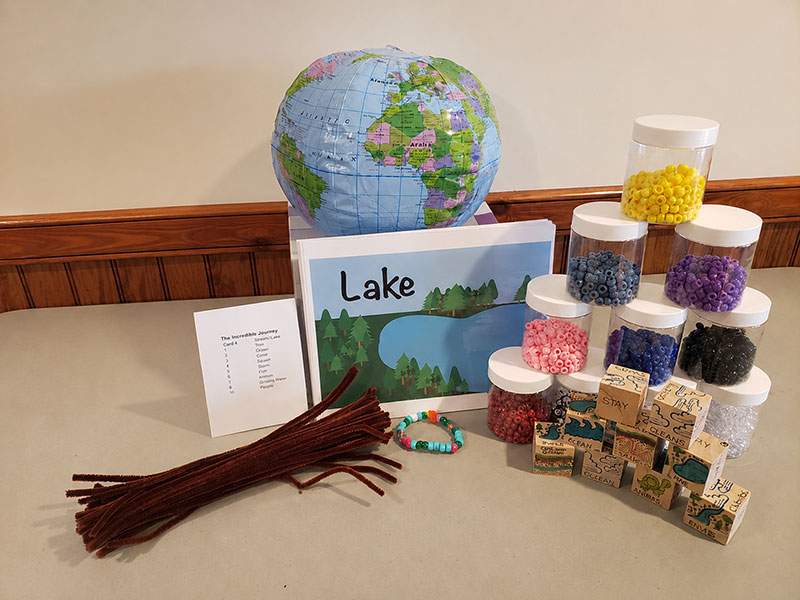
The Earth is often called the blue planet because 71% of the Earth’s surface is covered by water. Water molecules use the sun’s energy to move within the Earth and atmosphere; we call this journey the Water Cycle, and in this lesson, we will learn that this journey has many paths.
We begin the lesson with a fun activity. We will toss a globe-patterned beachball from student to student to collect data to determine that ~ ¾ (71%) of the Earth’s surface is covered by water. This activity reinforces the concept that the Earth has abundant water. Next, we'll tackle a common misconception about the water cycle. Many think it's a simple, continuous loop: water falls from the sky, flows into rivers, reaches the ocean, evaporates into the atmosphere, condenses into clouds, and then falls back to Earth as precipitation, starting the cycle all over again. (Most textbook water cycle diagrams reinforce this simplistic view of the water cycle). While it's true that water circulates on Earth, it doesn't follow a linear path or spend equal time in each stage. For example, the sun provides energy that causes surface water to evaporate; water vapor condenses in the clouds and falls back to the surface as precipitation; glaciers melt into the ocean, and groundwater can be pumped up to the surface to water plants, etc. Water indeed circulates, but its path is not linear, and water does not spend equal time in each space. In this activity, students become water molecules and move through the water cycle creating a map of their journey and a bracelet to document their journey. This hands-on experience will help students understand that the water cycle is more than just a predictable two-dimensional path – it's a dynamic, ever-changing journey.
Materials:
Materials provided in the :
- Activity 1: Globe beach ball, whiteboard/flipchart, and marker
- Activity 2: Water Cycle Activity Kit, 9 location cards, 9 blocks, 30 pipe cleaners, and 9 containers of colored pony beads.
- Reading Connection: One Well by Strauss & Woods
Materials you will need to gather:
- Lesson 1 slide show
- Activity 2: one copy of the Water Journey Map for each student
(Note- you will need to write the bead color for each station on the map before copying). - Assessment: one copy of the Exit Ticket for each student.
Learning Objectives:
At the completion of the lesson, students will be able to:
- Use data to calculate the percent of the Earth’s surface covered in water.
- Describe the movement of water within the water cycle.
Activities:
*adapted from Project Wet Activity & Curriculum Guide 2.0
This activity can be completed inside the classroom, on the lawn, or in the parking lot.
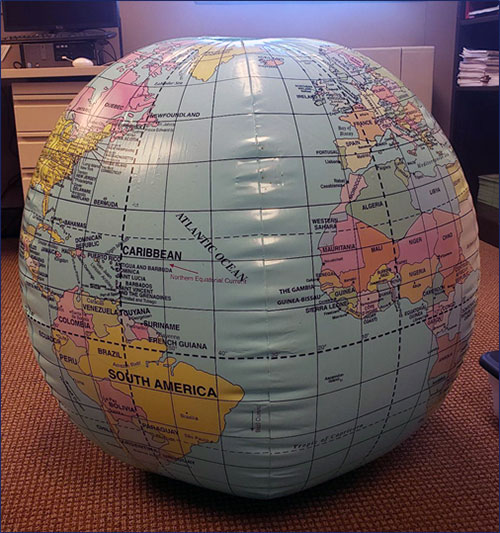 Show the students the globe beachball and ask them what it represents.
- What colors do they see?
- Why do some people call the Earth the blue planet?
CALL TO ACTION - Tell students that in this unit, they will learn about the water on Earth and how we can help keep our water clean.
Ask students if they know What percent of the Earth’s surface is covered by water? Ask them if they are guessing. If you know how much of the Earth’s surface is covered by water, how do you know? Did someone tell you? Did you read it in a book?
Ask students if they know What percent of the Earth’s surface is covered by water? Ask them if they are guessing. If you know how much of the Earth’s surface is covered by water, how do you know? Did someone tell you? Did you read it in a book?
Tell the students we will collect some data to answer this question ourselves. We will randomly sample Earth’s surface by tossing and catching the beachball. Each time the ball is caught, we will record whether the tip of the catcher’s right pinky finger is mostly on land or water.
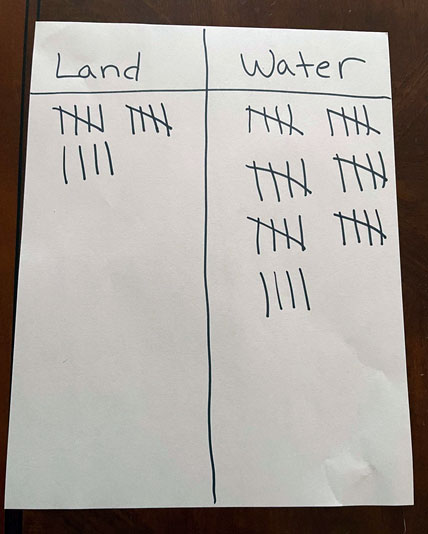 Make a t-chart on the board with water on one side and land on the other to record the data from each catch. Keep tossing until every student has had a turn and you have at least 30 data points.
Have the students return to their seats. As a class, look at the tally. Write a ratio representing the ratio of the number of water catches to the total number of catches. This will give us the percent of the Earth’s surface covered by water. Convert this to a percentage. Repeat this process for the ratio of the land catches to the total number of catches. (Example: Land=14, Water=34, Total 48. The water ratio is 34/48 or 71%)
Scientists and geographers have found that 71% of the Earth’s surface is covered by water. Ask students how their data compares. If the class’s percentages are vastly different from 71%, can they explain why? What could they do to get more accurate data? (Answers may include collecting more data.)
Possible Extension:
Have students calculate the ratios independently and compare answers.
Have the students create a pie graph to represent their data.
Possible Differentiation Adaptations:
Have students sit in a circle and roll the ball to each other instead of tossing it.
Create a worksheet for the calculations that set up the first ratio (total water catches/total catches), and then have students set up the second ratio (total land catches/total catches).
Suppose students don’t know ratios and use long division yet to get those ratios, but they have a basic knowledge of fractions. In that case, you can do 100 catches to get a more understandable fraction (70/100). Students may benefit from a visual representation of the data collected. Providing students with a hundreds chart to fill in how many catches were “water” may help them to see the results.
*adapted from Project WET
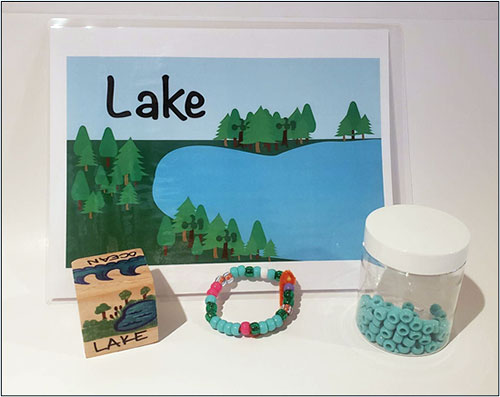
Before class, set up the nine water cycle stations around the room. Each station should include a location card, the corresponding movement block, and a container of beads. Use the list below to match each station with the correct block.
Cube Station Name
| 1 | Soil | 5 | Ocean | 9 | Glacier |
| 2 | Plant | 6 | Lake | ||
| 3 | River | 7 | Animal | ||
| 4 | Clouds | 8 | Ground Water |
Project the following image.
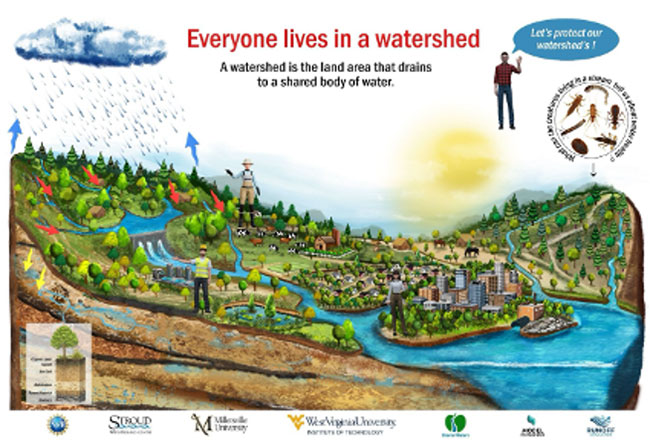
Gather students around the Classroom Watershed Poster and invite them to study the landscape. Ask, "Where do you see water?" Record their observations (e.g., rivers, lakes, oceans, clouds, groundwater, snow, rain, and water vapor). Then ask, "How did the water get there?" Explain that they will return to this poster throughout the unit to investigate how water moves through a watershed and to discover new features as their understanding grows.
Water exists in many forms and in many places on Earth. Water uses energy from the sun, so it can change forms and change where it exists on Earth. We call this the water cycle.
Tell students they are about to become water molecules traveling through the water cycle. As they move, they will create both a map and a bracelet that record their unique journey.
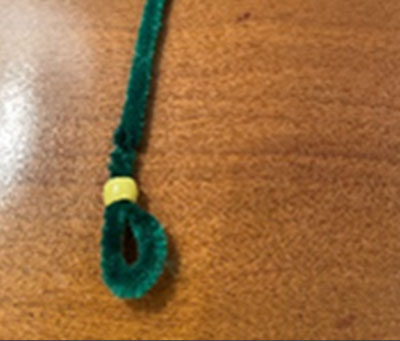 Give each student a pipe cleaner and have them form a small loop at one end. Students begin by adding a yellow bead to represent the sun. Explain that the sun provides the energy for the water molecules to travel around the water cycle. Now, they are ready to start their journey.
Divide the students among the nine stations. (In real life, water molecules are present at each location, so students can start at any station.) This is the starting point of their journey, and each person should get a bead at the station and add it to their bracelet.
Students then use the movement blocks to determine where they travel next. The first student in line rolls the die and follows the direction indicated on the block. If instructed to stay, the student collects another bead from that station and returns to the back of the line. If the die directs them to another station, they travel there, collect the matching bead, and join the back of that station's line. Continue the simulation for approximately 10 minutes.
 Give students a paper copy of the Water Journey Map and explain to the students that they will use this map to record their journey. (Before making copies, write the bead color that corresponds to each station on the map.) Tell students to use the colors on their bracelets to draw lines and arrows showing how they traveled through the water cycle.
Bring the class together to compare bracelets and journey maps. Ask students what they notice. How are their journeys similar? How are they different? “Look at all the places you found water in the picture we discussed at the beginning of class (Project theWater Location picture again). How does the water get to these places, and how does it travel from place to place?” Ask guiding questions to help students determine that the water cycle is not a big circle where water travels in a linear path, spending equal amounts of time at each place. Instead, the water cycle is a natural process where water can travel on many paths and spend a short or long time in each location.
Possible Adaptation:
NASA has a digital alternative to activity 2, see - Water Cycle Dice Game.
Assessment:
Give each student an exit ticket with two questions:
- Why do some people call the Earth the Blue Planet?
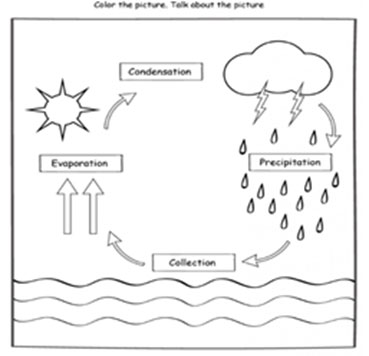
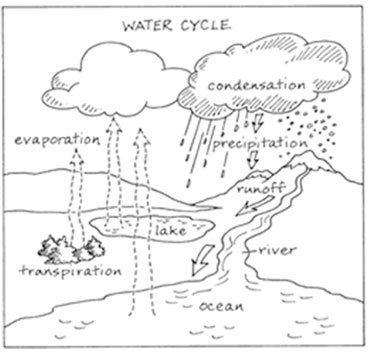
- Which is a better picture of the water cycle? Explain.
Reading Connection:
Strauss, R., & Woods, R. (2007). One Well: The story of water on Earth. Kids Can Press.