Lesson 7: Chemical Analysis of a Natural Body of Water
In the last lesson, students discovered that the Earth acts as a natural filter. As water moves through layers of soil, sand, gravel, and rock, many impurities are removed before the water reaches underground aquifers. But does water that looks clean always mean it's healthy?
A common misconception among elementary-aged students is that clear water is always healthy, while murky or cloudy water must be polluted. In this lesson, students will discover that you can't judge the quality of water simply by looking at it. Instead, they'll perform a series of chemical tests on water from a local stream, river, lake, or pond and use the data they collect to learn more about the water.
Whenever possible, complete this lesson outdoors at a local stream. Testing water where it was collected provides students with a direct connection to the environment and a more authentic scientific investigation. However, if time, distance, or weather conditions make a field experience impractical, you can collect water from a local waterway and bring it back to the classroom for analysis. (See the resource folder for a short video demonstrating proper water sample collection.)
When collecting water for your students, remember to record the stream temperature, as students will need this information when calculating dissolved oxygen. (video on how to collect the water). Water for most tests can be collected in a clean bucket or jug. However, the dissolved oxygen sample must be collected in a capped bottle, such as an empty Gatorade bottle, that is filled completely to overflowing before the cap is secured. This ensures there is no trapped air in the bottle, which could affect the dissolved oxygen measurement.
The fact sheets provided in this lesson offer a basic understanding of the parameters for each water quality indicator measured in this lesson: Dissolved Oxygen, Phosphates and Nitrates, pH, Turbidity, Water TemperatureSafety: If you can bring students to sample streamside, here are some safety considerations. Visit the location before bringing students to identify spots to safely walk into the water, such as areas that aren’t too steep or muddy and can accommodate one adult and one to three students. Also, look for other hazards such as litter, poison ivy, or stinging nettle. Never enter a body of water deeper than below the students’ knees, especially in moving water like a stream or river. Do not sample during inclement weather or high water events. Plan to bring extra adults along on the day of the trip to help you monitor students. Students can easily fall into the water, so be sure to sample on warm sunny days or bring changes of clothing.
Chemicals: As with any chemical, some safety measures should be taken to ensure student safety. Safety data sheets for the chemicals used in the lesson can be found in the lesson 7 resource folder.
Dissolved Oxygen, pH, Phosphate, NitrateMaterials:
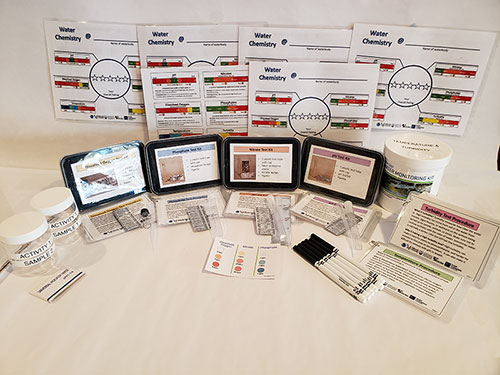
Materials provided in the :
- Activity 1: 2 clear bottles & pH Strips
- Activity 2: Student Data Sheet* & 6 black, fine tip whiteboard markers
- Activity 2: Water Chemistry kits for each test: Dissolved Oxygen, Nitrate, Phosphate, pH, Temperature, Turbidity
Materials you will need to gather:
- Lesson 7 slide show
- Activity 1: White vinegar
- Activity 1: YouTube Video, “Monitoring the Health of Our Waters”
- Activity 2: timer, large class data chart, waste bottles
- Activity 2: Safety: If you have access to safety goggles, have students wear them
Learning Objectives:
At the completion of the lesson, students will be able to:
- Accurately measure several chemical indicators of water quality.
- Analyze data gathered from water quality tests.
- Make conclusions based on evidence as to the health of a water body.
Activities:
To prepare for the activity, fill two similar bottles. Bottles should be clear and have caps or lids. Fill one with white vinegar and the other with drinking water. Display the bottles on a table for students to see. Ask the class if the water in each bottle would be considered healthy for the environment. Allow students to discuss their thoughts with a partner. Additional prompts can include, ‘What does it mean for water to be healthy,’ ‘What would healthy water look like?’ or ‘What words would you use to describe unhealthy water.’ Once students have had sufficient time to discuss, ask the class, “What data would you need to answer the question, ‘Is the water within the bottles healthy for the environment?’” Allow students to answer.
Next, have a volunteer come up and uncap and examine each bottle. The student should notice a big difference in smell! Have the volunteer share with the class their observations. Use the pH strips to test the pH of each bottle quickly.
Let students know, “In order to measure the quality or health of the water properly, it is important that we understand the scientific practices related to testing water quality.” Ask the class to predict some things that might be important when testing the health of the water. Discuss. Then, play the beginning of the water chemistry video, “Monitoring the health of our waters,” for students.
Possible Differentiation Adaptations:
Create a Nearpod for the video and include checks for understanding. Nearpod can provide individual performance statistics, which can help you identify students who had difficulty understanding the video's content.
Note: This activity can be done in the classroom or at the stream. If you are doing this activity in the classroom, stream samples should be collected in the morning and stored in capped bottle(s) that were filled to overflowing. Be sure to record the temperature of the water when taking the sample; this data is needed to calculate dissolved oxygen.
Divide students into five groups and provide each group with a laminated data sheet and a fine-tip whiteboard marker. Set up a testing station for each water quality investigation:
- Dissolved Oxygen
- Nitrates
- pH
- Phosphate
- Turbidity
*Water temperature must be measured at the stream when the sample is collected.
DISPOSAL - Place a waste bottle with a cap at each station for students to dispose of used chemicals. An empty Gatorade bottle works well. If completing this lesson outdoors, be sure to bring the waste bottle with you. Do not dispose of wastewater outdoors or in the stream. Bring the waste back to school and follow the disposal instructions included in the test kit manual. See page 8 in the instruction manual for disposal instructions.
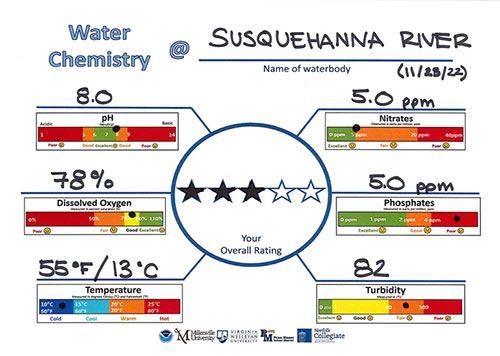 Have groups rotate through the testing tables to complete as many tests as possible.Students should fill in their data sheets and discuss their findings with their small groups. Time estimates for each test are included below. If students finish early, they should clean up the table and predict what they will find in the next station.
- Dissolved Oxygen: 13 minutes
- Nitrates: 11 minutes
- pH: 5 minutes
- Phosphate: 9 minutes
- Temperature: 5 minutes
- Turbidity: 5 minutes
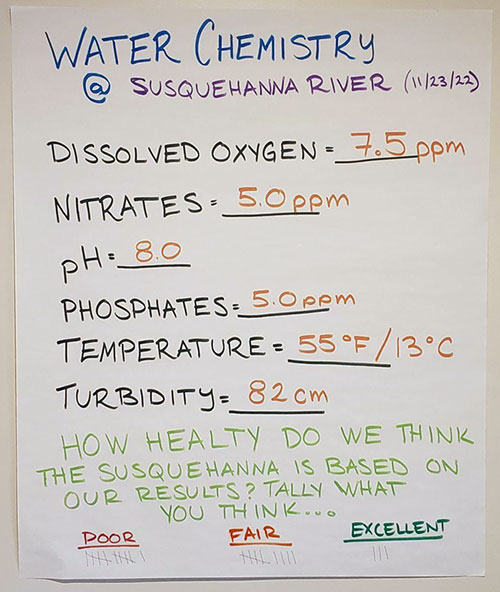 Bring the class back together and have them record their data on a large data sheet at the front of the class. Groups should use the class data to fill in any data they are missing. Have each group rate the stream's overall health using 5 stars. As a class, discuss what the data reveals about the stream's health. Explain that the chemical tests provide valuable information about the water, but they are only one part of the story. In the next lesson, students will investigate another important indicator of stream health by studying the organisms that live in the water.
Possible Extension #1:
If you take the class to the stream, you can also include a physical stream assessment. A physical survey is a great tool that generates a third way to look at stream health.
Possible Extension #2:
Compare water at different points along the stream, such as an upstream or downstream location. Other ideas include getting a jug of water from a stream that flows into the waterbody you’re studying, the river your stream flows into, the outflow of a lake or reservoir, downstream of a golf course or other major landuse, or downstream from a major city like Harrisburg.
Possible Differentiation Adaptations:
The teacher may feel more comfortable walking through each water quality investigation using a demonstration. For example, the teacher models a step in the investigation, and then the students complete the step, and so on.
See the complete LaMotte instruction booklet for instructions and information in Spanish.
Assessment:
Use the water chemistry datasheet to evaluate the overall health of the stream.
- Excellent
- Good
- Fair
- Poor
Evidence: Which pieces of evidence did you find in your data to support your claim?
Reasoning: Why does your evidence support your claim?